SAN-EI AM Solar Simulator —
New Standard for Measurement and Evaluation
From April 1, 2025, SAN-EI will evaluate all Solar Simulators based on “IEC 60904-9_2020” and “SAN-EI 2025-04” standards.
Those Standards also applies to the maintenance required to maintain the performance of SAN-EI Solar Simulators.
- Based on requests from customers in various fields, we created this in-house standard in April 2025 for the purpose of evaluating the accuracy of Solar Simulators “under conditions not specified in conventional standards.”
- “SAN-EI 2025-04” was created with reference to “IEC 60904-9_2020”.
- The content will be updated according to changes in international standards and customer requirements. (the name will also be updated accordingly.)
- “AM1.5G 300-1200nm” is based on “IEC 60904-9_2020”.
- “AM1.5G 300-1800nm and 300-2200nm” complies with “SAN-EI 2025-04”.
- “300-1200nm, 300-1800nm and 300-2200nmat AM0” comply with “SAN-EI 2025-04“.
- “Measurement and Evaluation” of AM1.5G and AM0 is performed as follows.
* The parts in red in this document are specified in “SAN-EI 2025-04“. The rest complies with “IEC 60904-9_2020”.
AM1.5G
Setting “Reference Irradiance” for Measurement
- Measurement Receiver : Pyranometer or Reference Cell
When “Effective Irradiation Surface” is □40mm to □50mm, we use Pyranometer.
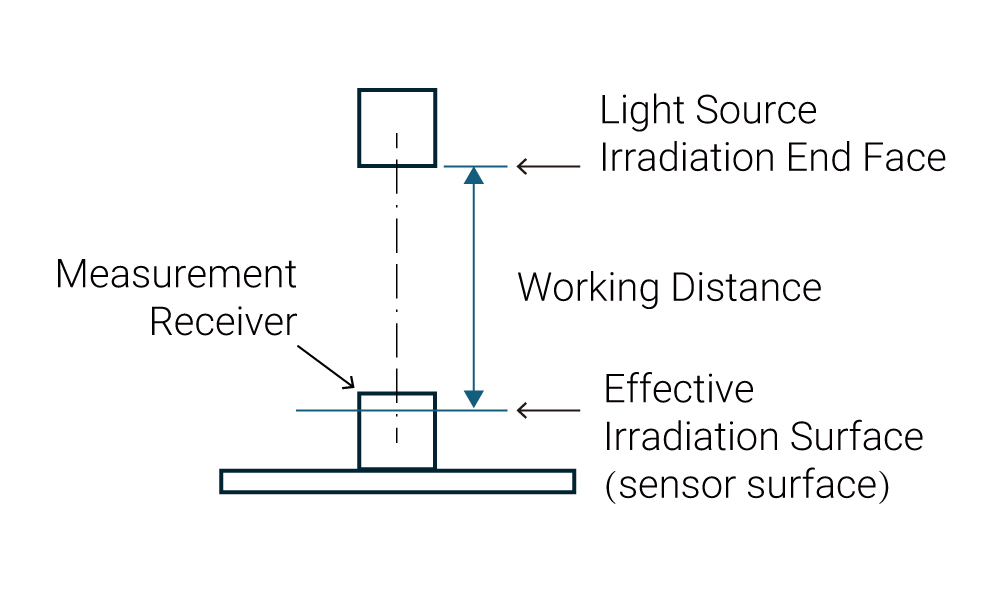
When “Effective Irradiation Surface” is □70mm to □400mm, we use Reference Cell. - Measurement Position (Working Distance)
Measurement Receiver is placed so that its light receiving surface (sensor surface) is at Working Distance. - Measurement Position (on Irradiation Surface)
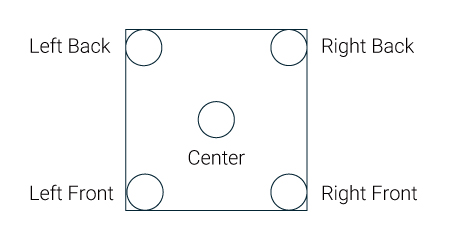
Center of Effective Irradiation Surface
① Wait until Lamp turns on and becomes “Stable” (20 to 30 minutes).
② Using Measuring Receiver, measure Irradiance at 5 points shown in the figure.
③ Measured Irradiance is calculated using the following formula:
Maximum−Minimum
Maximum+Minimum
× 100 (%)
④ Adjust Lamp Position so that the calculated value is 1.5% or less.
⑤ Adjust Lamp Current so that Center Measurement Value becomes Constant of Measurement Receiver.
- Reference Irradiance
1000W/m2(±5%)
Irradiance is adjusted based on Sensitivity Constant of Measurement Receiver.
Temporal Instability
Measurement Receiver : Pyranometer or Reference Cell
When “Effective Irradiation Surface” is □40mm to 50mm, we use Pyranometer.
When “Effective Irradiation Surface” is □70mm to 400mm, we use Reference Cell.Measurement Position (Working Distance)
Measurement Receiver is placed so that its light receiving surface (sensor surface) is at Working Distance.Measurement Position (on Irradiation Surface)
Center of Effective Irradiation SurfaceReference Irradiance
1000W/m2(±5%)
Irradiance is adjusted based on Sensitivity Constant of Measurement Receiver.
- Short Term Instability (STI)
Measured 30 minutes after Lamp turned on
Measurement Interval: 1/1000 seconds
Measurement Time (number of times) : 1 second (1000 times)
Measurement and Recording using Measurement Receiver and Data Logger - Long Term Instability (LTI)
Measured 30 minutes after Lamp turned on
Measurement Interval: 1/2 seconds
Measurement Time (number of times) : 1 hour (7200 times)
Measurement and Recording using Measurement Receiver and Data Logger
Extract Minimum and Maximum Output Voltage from Measurement Receiver
Calculate “Temporal Instability” using the following formula.
Maximum−Minimum
Maximum+Minimum
× 100 (%)
Create a chart
“Temporal Instability” calculated using the above formula is evaluated based on the table below.
| Short Term Instability (STI) | Evaluation Grade |
|---|---|
| ≤ 0.25 % | A+ |
| ≤ 0.5 % | A |
| ≤ 2 % | B |
| ≤ 10 % | C |
| Long Term Instability (LTI) | Evaluation Grade |
|---|---|
| ≤ 1 % | A+ |
| ≤ 2 % | A |
| ≤ 5 % | B |
| ≤ 10 % | C |
Irradiance Uniformity
Measurement Receiver : Pyranometer or Reference Cell
When “Effective Irradiation Surface” is □40mm to 50mm, we use Pyranometer.
When “Effective Irradiation Surface” is □70mm to 400mm, we use Reference Cell.Measurement Position (Working Distance)
Measurement Receiver is placed so that its light receiving surface (sensor surface) is at Working Distance.Measurement Position (on Irradiation Surface)
Center of Effective Irradiation SurfaceReference Irradiance
1000W/m2(±5%)
Irradiance is adjusted based on Sensitivity Constant of Measurement Receiver.
- Measurements are carried out based on the table below.
- Measurement Receiver is placed so that its light receiving surface is at Working Distance.
- Measurement Position (on Irradiation Surface)
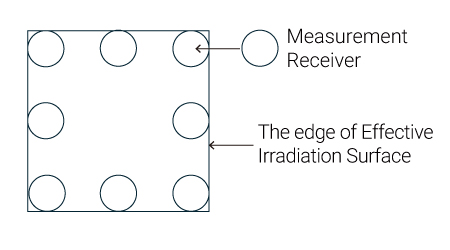
Measure 25 to 400 points as shown in the table below.
(Note) Align the edge of the light receiving surface of Measurement Receiver with the edge of Effective Irradiation Surface.
| Effective Irradiation Surface Size | Measurement Receiver | Photosensitive Area Size | Number of Measurement Points |
|---|---|---|---|
| □ 40 × 40 mm | Pyranometer | □ 8 mm | 5 × 5 25 |
| □ 50 × 50 mm | □ 10 mm | ||
| □ 70 × 70 mm | Reference Battery | □ 14 mm | 8 × 8 64 |
| □ 80 × 80 mm | □ 16 mm | ||
| □ 100 × 100 mm | □ 20 mm | 10 × 10 100 | |
| □ 160 × 160 mm | 11 × 11 121 | ||
| □ 200 × 200 mm | 13 × 13 169 | ||
| □ 220 × 220 mm | 15 × 15 225 | ||
| □ 250 × 250 mm | 20 × 20 400 | ||
| □ 300 × 300 mm | |||
| □ 400 × 400 mm |
The reading on Measurement Receiver(output voltage) will fluctuate slightly, so record Intermediate Value.
Extract Minimum and Maximum Output Voltage from Measurement Receiver
Calculate “Irradiance Uniformity” using the following
Maximum−Minimum
Maximum+Minimum
× 100 (%)
Create a chart formula
“Irradiance Uniformity” calculated using the above formula is evaluated based on the table on the right.
| Irradiance Uniformity | Evaluation Grade |
|---|---|
| ≤ 1 % | A+ |
| ≤ 2 % | A |
| ≤ 5 % | B |
| ≤ 10 % | C |
Spectral Match
Measurement Receiver : Pyranometer or Reference Cell
When “Effective Irradiation Surface” is □40mm to 50mm, we use Pyranometer.
When “Effective Irradiation Surface” is □70mm to 400mm, we use Reference Cell.Measurement Position (Working Distance)
Measurement Receiver is placed so that its light receiving surface (sensor surface) is at Working Distance.Measurement Position (on Irradiation Surface)
Center of Effective Irradiation SurfaceReference Irradiance
1000W/m2(±5%)
Irradiance is adjusted based on Constant of Measurement Receiver.
Using Spectrometer, measure and record Irradiance in the range 300-2200 nm to 1 nm increments.
Measurement Position is
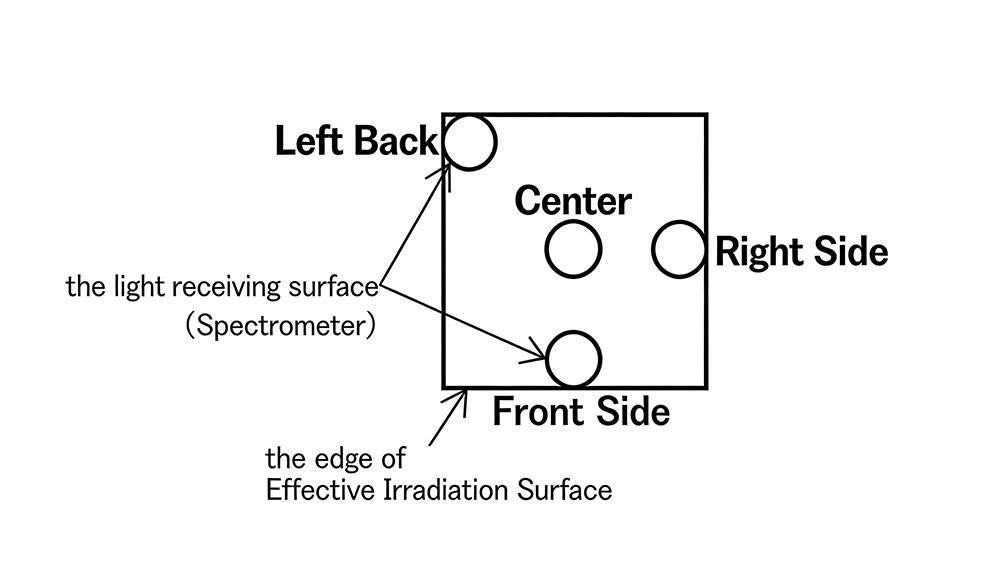
– When Effective Irradiation Area is □40mm to □100mm, only Center in the figure below.
– When Effective Irradiation Area is □160mm to □400mm, 4 points in the figure below.Except for Center, the light receiving surface edge of Spectroscope is made to contact Effective Irradiation Surface Edge.
Organize the data for each of 4 measurement points. (When Effective Irradiation Area is □40mm-□100mm, only Center.)
Calculate Interval Sum for each Wavelength.
Calculate Sum of each Wavelength Range as shown in the table below.
| Wavelength Range to be evaluated (AM1.5G) | ||
|---|---|---|
| 300–1200 nm | 300–1800 nm | 300–2200 nm |
| Wavelength Range | Wavelength Range | Wavelength Range |
| 300–470 nm | 300–458 nm | 300–443 nm |
| 470–561 nm | 458–536 nm | 443–506 nm |
| 561-657 nm | 536–616 nm | 506–570 nm |
| 657-772 nm | 616–703 nm | 570–637 nm |
| 772-919 nm | 703–809 nm | 637–708 nm |
| 919-1200 nm | 809–970 nm | 708–797 nm |
| 970–1208 nm | 797–900 nm | |
| 1208–1800 nm | 900–1061 nm | |
| 1061–1302 nm | ||
| 1302–2200 nm | ||
Calculate Percentage for each Wavelength Range using the following formula.
Sum of Wavelength Range
Sum of All Wavelength Range
× 100 (%)
(NOTE) Calculate all Wavelength Ranges.
The following formula is used to calculate “Spectrum Match”
(NOTE) Calculate for each Wavelength Range.
| Wavelength Range to be evaluated (AM1.5G) | |||||
|---|---|---|---|---|---|
| 300–1200 nm | 300–1800 nm | 300–2200 nm | |||
| Wavelength Range | Ratio | Wavelength Range | Ratio | Wavelength Range | Ratio |
| 300–470 nm | 16.61 % | 300–458 nm | 12.52 % | 300–443 nm | 9.98 % |
| 470–561 nm | 16.74 % | 458–536 nm | 12.54 % | 443–506 nm | 9.93 % |
| 561–657 nm | 16.67 % | 536–616 nm | 12.45 % | 506–570 nm | 9.97 % |
| 657–772 nm | 16.63 % | 616–703 nm | 12.45 % | 570–637 nm | 9.99 % |
| 772–919 nm | 16.66 % | 703–809 nm | 12.51 % | 637–708 nm | 9.96 % |
| 919–1200 nm | 16.69 % | 809–970 nm | 12.49 % | 708–797 nm | 10.04 % |
| Total 100.00 % | 970–1208 nm | 12.47 % | 797–900 nm | 10.00 % | |
| 1208–1800 nm | 12.56 % | 900–1061 nm | 10.03 % | ||
| Total 100.00 % | 1061–1302 nm | 10.03 % | |||
| 1302–2200 nm | 10.08 % | ||||
| Total 100.00 % | |||||
Extract Minimum and Maximum values from “Spectral Matches” for each Wavelength Range.
Extract Minimum and Maximum values at each Measurement Position (1 or 4).
Minimum and Maximum of all measurements is taken as “Spectral Match” for that product.
Range (Minimum to Maximum) of “Spectral Match” determined above is evaluated based on the table below.
| Wavelength Range to be evaluated (AM1.5G) | |||||
|---|---|---|---|---|---|
| 300–1200 nm | 300–1800 nm | 300–2200 nm | |||
| Spectral Match | Evaluation Grade | Spectral Match | Evaluation Grade | Spectral Match | Evaluation Grade |
| 92.5 – 107.5 % | A++ | ||||
| 87.5 – 112.5 % | A+ | 87.5 – 112.5 % | S+ | 87.5 – 112.5 % | SS+ |
| 75 – 125 % | A | 75 – 125 % | S | 75 – 125 % | SS |
| 60 – 140 % | B | ||||
| 40 – 200 % | C | ||||
AM0
Setting “Reference Irradiance” for Measurement
- Measurement Receiver : Pyranometer or Reference Cell
When “Effective Irradiation Surface” is □40mm to □50mm, we use Pyranometer.
When “Effective Irradiation Surface” is □70mm to □400mm, we use Reference Cell. - Measurement Position (Working Distance)
Measurement Receiver is placed so that its light receiving surface (sensor surface) is at Working Distance. - Measurement Position (on Irradiation Surface)
Center of Effective Irradiation Surface
① Wait until Lamp turns on and becomes “Stable” (20 to 30 minutes).
② Using Measuring Receiver, measure Irradiance at 5 points shown in the figure.
③ Measured Irradiance is calculated using the following formula:
Maximum−Minimum
Maximum+Minimum
× 100 (%)
④ Adjust Lamp Position so that the calculated value is 1.5% or less.
⑤ Adjust Lamp Current so that Output Voltage of Measuring Receiver at Center is 1.2 times Sensitivity Constant.
- Reference Irradiance
1348W/m2(±5%) —-This value is defined as “1 SUN of AM O”. ※❶
Adjust Irradiance so that Output Voltage of Measurement Receiver is 1.2 times Sensitivity Constant. ※❷
※❶ Reason: why “1 SUN of AM O” is “1348W/m2”
- It is well known that “1 SUN of AM1.5G” is “1000W/m2”.
- This is “Total Radiant Energy Value from 280 to 4000 nm” based on “ASTM G173-03.”
(”ASTM G173-03″ is data on AM1.5G Radiant Energy.) - Similarly, “Total Radiant Energy from 280 to 4000 nm” of “ASTM E-490” is “1348 W/m2.”
(”ASTM E-490″ is data for AM 0 Radiant Energy.)
※❷ Reason for setting “1.2 times Sensitivity Constant of Measurement Receiver as 1 SUN of AM 0”
- There is no dedicated Measuring Device for Measuring AM 0 Light.
- Reference Cells and Pyranometers can only measure in 400-1100nm range.
- Total Radiant Energy Value of “ASTM G173-03” in “400-1100 nm” range is “759 W/m2”.
- Total Radiant Energy Value of “ASTM E-490” in “400-1100 nm” range is “908 W/m2”.
- 「908W/m2」÷「759W/m2」=1.20
- Radiant Energy of AM 0 at “400-1100 nm” is 1.2 times that of AM1.5G.
- Therefore, “Radiant Energy that is 1.2 times Sensitivity Constant of Measuring Receiver” is defined as “1348 W/m2.”
(NOTE) It only applies to Light with “Spectral Match of 75-125%.”
Temporal Instability
Measurement Receiver : Pyranometer or Reference Cell
When “Effective Irradiation Surface” is □40mm to 50mm, we use Pyranometer.
When “Effective Irradiation Surface” is □70mm to 400mm, we use Reference Cell.Measurement Position (Working Distance)
Measurement Receiver is placed so that its light receiving surface (sensor surface) is at Working Distance.Measurement Position (on Irradiation Surface)
Center of Effective Irradiation SurfaceReference Irradiance
1348W/m2(±5%)
Adjust Irradiance(Lamp Current) so that Output Voltage of Measurement Receiver is 1.2 times Sensitivity Constant.
- Short Term Instability (STI)
Measured 30 minutes after Lamp turned on
Measurement Interval: 1/1000 seconds
Measurement Time (number of times) : 1 second (1000 times)
Measurement and Recording using Measurement Receiver and Data Logger - Long Term Instability (LTI)
Measured 30 minutes after Lamp turned on
Measurement Interval: 1/2 seconds
Measurement Time (number of times) : 1 hour (7200 times)
Measurement and Recording using Measurement Receiver and Data Logger
Extract Minimum and Maximum Output Voltage from Measurement Receiver
Calculate “Temporal Instability” using the following formula.
Maximum−Minimum
Maximum+Minimum
× 100 (%)
Create a chart
“Temporal Instability” calculated using the above formula is evaluated based on the table below.
| Short Term Instability (STI) | Evaluation Grade |
|---|---|
| ≤ 0.25 % | A+ |
| ≤ 0.5 % | A |
| ≤ 2 % | B |
| ≤ 10 % | C |
| Long Term Instability (LTI) | Evaluation Grade |
|---|---|
| ≤ 1 % | A+ |
| ≤ 2 % | A |
| ≤ 5 % | B |
| ≤ 10 % | C |
Irradiance Uniformity
Measurement Receiver : Pyranometer or Reference Cell
When “Effective Irradiation Surface” is □40mm to 50mm, we use Pyranometer.
When “Effective Irradiation Surface” is □70mm to 400mm, we use Reference Cell.Measurement Position (Working Distance)
Measurement Receiver is placed so that its light receiving surface (sensor surface) is at Working Distance.Measurement Position (on Irradiation Surface)
Center of Effective Irradiation SurfaceReference Irradiance
1348W/m2(±5%)
Adjust Irradiance(Lamp Current) so that Output Voltage of Measurement Receiver is 1.2 times Sensitivity Constant.
- Measurements are carried out based on the table below.
- Measurement Receiver is placed so that its light receiving surface is at Working Distance.
- Measurement Position (on Irradiation Surface)
Measure 25 to 400 points as shown in the table below.
(Note) Align the edge of the light receiving surface of Measurement Receiver with the edge of Effective Irradiation Surface.
| Effective Irradiation Surface Size | Measurement Receiver | Photosensitive Area Size | Number of Measurement Points |
|---|---|---|---|
| □ 40 × 40 mm | Pyranometer | □ 8 mm | 5 × 5 25 |
| □ 50 × 50 mm | □ 10 mm | ||
| □ 70 × 70 mm | Reference Cell | □ 14 mm | 8 × 8 64 |
| □ 80 × 80 mm | □ 16 mm | ||
| □ 100 × 100 mm | □ 20 mm | 10 × 10 100 | |
| □ 160 × 160 mm | 11 × 11 121 | ||
| □ 200 × 200 mm | 13 × 13 169 | ||
| □ 220 × 220 mm | 15 × 15 225 | ||
| □ 250 × 250 mm | 20 × 20 400 | ||
| □ 300 × 300 mm | |||
| □ 400 × 400 mm |
The reading on Measurement Receiver(output voltage) will fluctuate slightly, so record Intermediate Value.
Extract Minimum and Maximum Output Voltage from Measurement Receiver
Calculate “Irradiance Uniformity” using the following
Maximum−Minimum
Maximum+Minimum
× 100 (%)
Create a chart formula
“Irradiance Uniformity” calculated using the above formula is evaluated based on the table on the right.
| Irradiance Uniformity | Evaluation Grade |
|---|---|
| ≤ 1 % | A+ |
| ≤ 2 % | A |
| ≤ 5 % | B |
| ≤ 10 % | C |
Spectral Match
Measurement Receiver : Pyranometer or Reference Cell
When “Effective Irradiation Surface” is □40mm to 50mm, we use Pyranometer.
When “Effective Irradiation Surface” is □70mm to 400mm, we use Reference Cell.Measurement Position (Working Distance)
Measurement Receiver is placed so that its light receiving surface (sensor surface) is at Working Distance.Measurement Position (on Irradiation Surface)
Center of Effective Irradiation SurfaceReference Irradiance
1348W/m2(±5%)
Adjust Irradiance(Lamp Current) so that Output Voltage of Measurement Receiver is 1.2 times Sensitivity Constant.
Using Spectrometer, measure and record Irradiance in the range 300-2200 nm to 1 nm increments.
Measurement Position is
– When Effective Irradiation Area is □40mm to □100mm, only Center in the figure below.
– When Effective Irradiation Area is □160mm to □400mm, 4 points in the figure below.Except for Center, the light receiving surface edge of Spectroscope is made to contact Effective Irradiation Surface Edge.
Organize the data for each of 4 measurement points. (When Effective Irradiation Area is □40mm-□100mm, only Center.)
Calculate Interval Sum for each Wavelength.
Calculate Sum of each Wavelength Range as shown in the table below.
| Wavelength Range to be evaluated (AM0) | ||
|---|---|---|
| 300–1200 nm | 300–1800 nm | 300–2200 nm |
| Wavelength Range | Wavelength Range | Wavelength Range |
| 300–448 nm | 300–437 nm | 300–421 nm |
| 448–538 nm | 437–516 nm | 421–489 nm |
| 538-636 nm | 516–600 nm | 489–557 nm |
| 636-756 nm | 600–696 nm | 557–629 nm |
| 756-927 nm | 696–820 nm | 629–714 nm |
| 927-1200 nm | 820–991 nm | 714–820 nm |
| 991–1257 nm | 820–957 nm | |
| 1257–1800 nm | 957–1151 nm | |
| 1151–1461 nm | ||
| 1461–2200 nm | ||
Calculate Percentage for each Wavelength Range using the following formula.
Sum of Wavelength Range
Sum of All Wavelength Range
× 100 (%)
(NOTE) Calculate all Wavelength Ranges.
The following formula is used to calculate “Spectrum Match”
(NOTE) Calculate for each Wavelength Range.
| Wavelength Range to be evaluated (AM0) | |||||
|---|---|---|---|---|---|
| 300–1200 nm | 300–1800 nm | 300–2200 nm | |||
| Wavelength Range | Ratio | Wavelength Range | Ratio | Wavelength Range | Ratio |
| 300-448 nm | 16.67 % | 300–437 nm | 12.53 % | 300–421 nm | 10.02 % |
| 448-538 nm | 16.56 % | 437–516 nm | 12.46 % | 421–489 nm | 10.02 % |
| 538-636 nm | 16.65 % | 516–600 nm | 12.46 % | 489–557 nm | 9.96 % |
| 636-756 nm | 16.27 % | 600–796 nm | 12.42 % | 557–629 nm | 9.94 % |
| 756-927 nm | 16.84 % | 796–820 nm | 12.45 % | 629–714 nm | 10.05 % |
| 927-1200 nm | 16.99 % | 820–991 nm | 12.52 % | 714–820 nm | 10.04 % |
| Total 100.00 % | 991–1257 nm | 12.51 % | 820–957 nm | 9.99 % | |
| 1257–1800 nm | 12.64 % | 957–1151 nm | 10.02 % | ||
| Total 100.00 % | 1151–1461 nm | 10.04 % | |||
| 1461–2200 nm | 9.93 % | ||||
| Total 100.00 % | |||||
Extract Minimum and Maximum values from “Spectral Matches” for each Wavelength Range.
Extract Minimum and Maximum values at each Measurement Position (1 or 4).
Minimum and Maximum of all measurements is taken as “Spectral Match” for that product.
Range (Minimum to Maximum) of “Spectral Match” determined above is evaluated based on the table below.
| Wavelength Range to be evaluated (AM0) | |||||
|---|---|---|---|---|---|
| 300–1200 nm | 300–1800 nm | 300–2200 nm | |||
| Spectral Match | Evaluation Grade | Spectral Match | Evaluation Grade | Spectral Match | Evaluation Grade |
| 92.5 – 107.5 % | A++ | ||||
| 87.5 – 112.5 % | A+ | 87.5 – 112.5 % | S+ | 87.5 – 112.5 % | SS+ |
| 75 – 125 % | A | 75 – 125 % | S | 75 – 125 % | SS |
| 60 – 140 % | B | ||||
| 40 – 200 % | C | ||||